There are more than 5 million active addresses in the Ethereum blockchain. This doesn’t mean that the network has 5 million users, but yes, that’s a good proxy. Although the information from these wallets is available on block explorers, such as Etherscan, depending on what one wants, getting this kind of information can be a bit more difficult.
In this sea of so many wallets, what information can they reveal to us? Are most of them profitable or not profitable? Do they buy and sell many tokens?
Considering this, I decided to conduct this research. We will take a certain number of wallets from the Ethereum blockchain and analyze the trade history of these wallets. Important: We will only analyze DexTrades, that is, trades made on decentralized exchanges, such as Uniswap, since conducting this type of analysis starting from centralized exchanges would be much more delicate.
Let’s get started!
Getting the wallets
The first step is to get the actual wallet addresses. Since we want to have a big scale, doing that manually would not be the best approach. Then, I used the Infura API to iterate through Ethereum blocks, capturing wallet addresses.
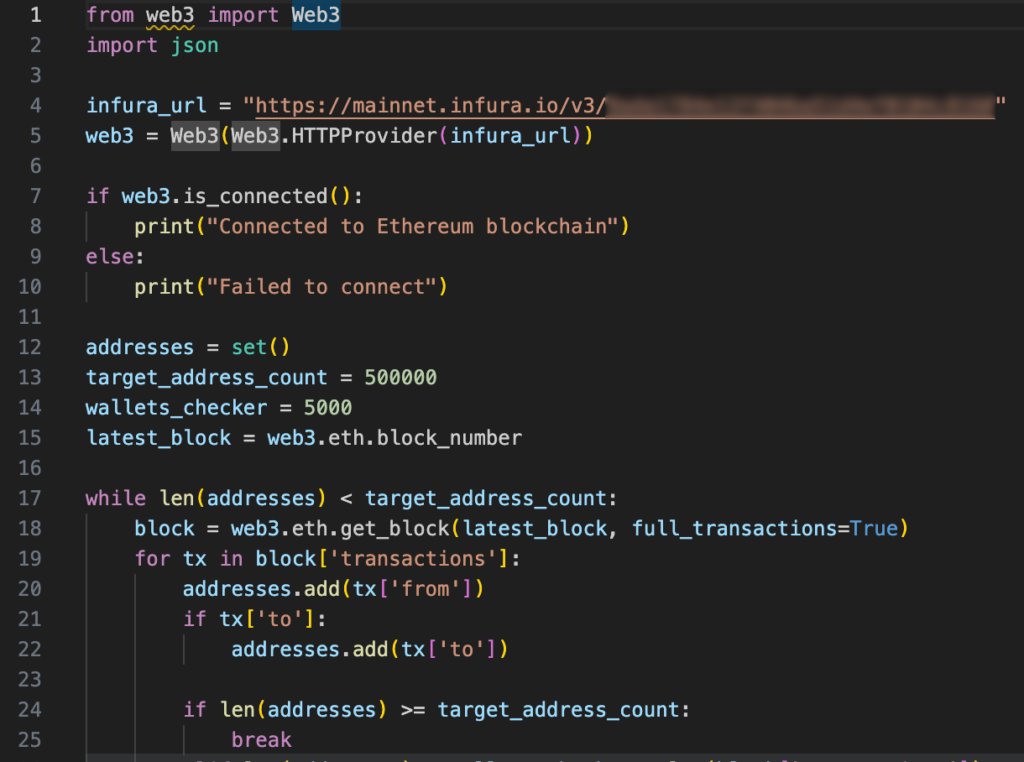
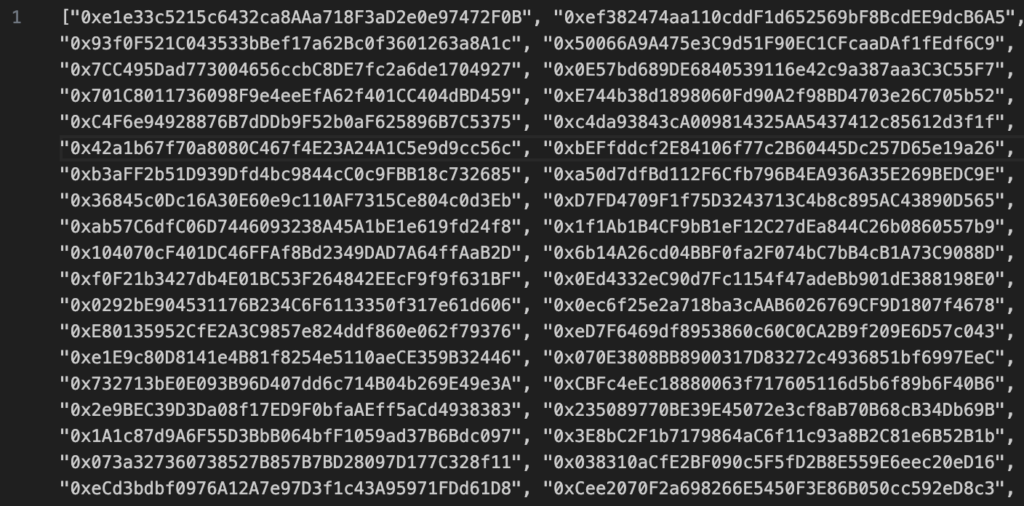
This isn’t, for sure, the most sophistificated approach, I admit. But c’mon, I just wanted some quick results, so this was perfect. It took only a few minutes to get more than 60,000 addresses, stored in a JSON.
Then, I store all the addresses into MongoDB, so we can retrieve them in our next step.
Getting trading metrics
Now we have more than 60,000 wallet addresses saved. Now, it’s time to rely on syve.ai to check the historical trading performance of these addresses. Using that API, we can return metrics such as ‘total return’, ‘realized return’, ‘total investiment’, and much more, related to the DexTrades of a given wallet address.
Then, I retrieved the data from MongoDB to get the trading stats of each wallet, storing the results again in MongoDB.
Awesome! But wait. Even before I looked into the data using pandas, I noticed something in Mongo:
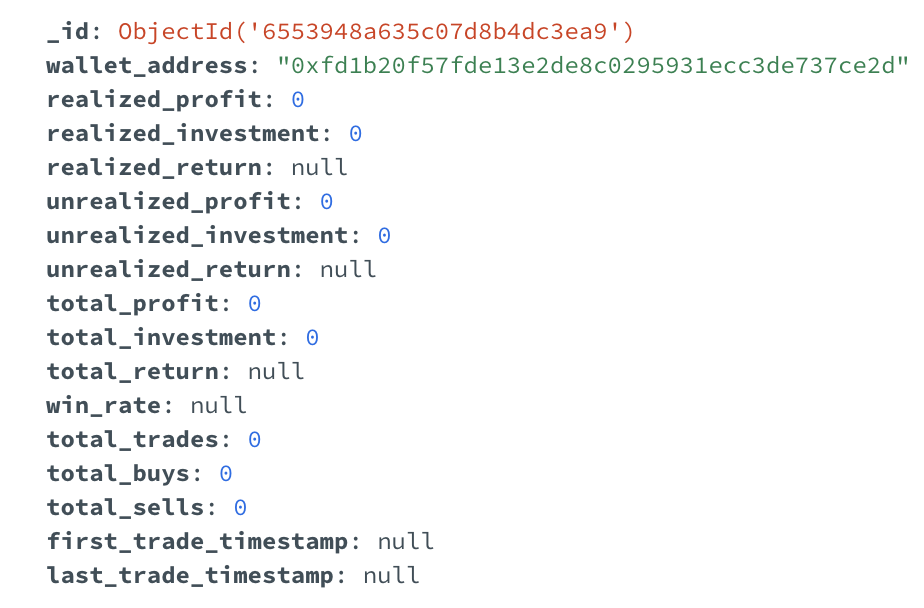
A lot of addresses returned those kind of results. That’s natural, since we just fetched a lot of addresses using Infura without any filter. Naturally, a lot of wallet_addresses are token or contract addresses, not necessarilly trades. Then, they will not bring Dextrades metrics.
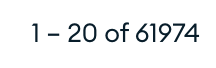
Okay, now we have more than 60,000 wallets to analyze. Let’s move on!
Cleaning the data
I exported our data from Mongo as a JSON and transformed it into a pandas dataframe. When I print it, here is what we get:
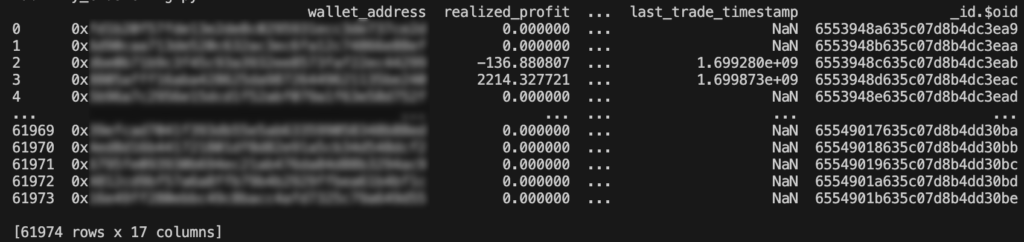
Pretty cool, right? Some important details here:
- We don’t need the _id column, this one was important automatically from Mongo.
- You can notice that a lot of addresses have 0 as realized profit and NaN as last_trade_timestamp. This happens because what I told you before: not all addresses are traders. Since we want to analyze just traders, we will drop the addresses where the column ‘first_trade_timestamp’ is missing.
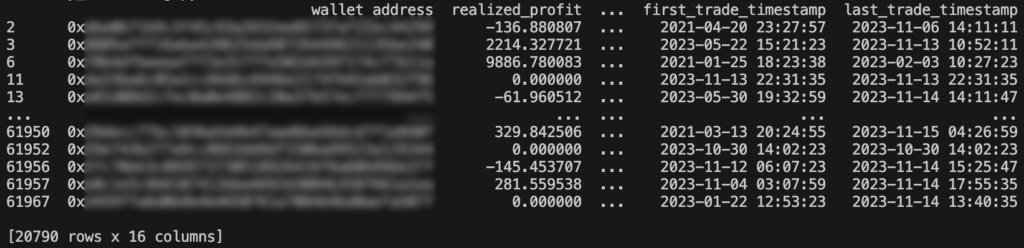
Great! We eliminated a lot of wallets that were unecessary for us. Now, we have more than 20k traders data in our dirty hands. It’s time for some exploratory data analysis.
Exploratory Data Analysis
I decided to make some statistical analysis of some columns, just to have some quick insights about the traders.
For example, when we analyze the total return of these more than 20k traders, here is what we get:
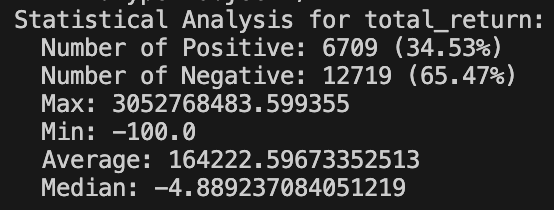
As we can see, out of 20k traders, more than 65% have negative returns in their trading. One of them is completely out of this world, with a staggering return of 3052768483%. Minimum return is, naturally, -100%. The average return is 164222%. However, since the median is -4.88%, this difference indicates a very skewed distribution, with the average being highly influenced by the giant returns.
Next, let’s analyze realized profit. This time, we will only analyze wallets with existing realized profit. Some wallets have NaN on that field. We will just ignore them and move on (that’s why the sum of the % in the image below are not equal to 100%).
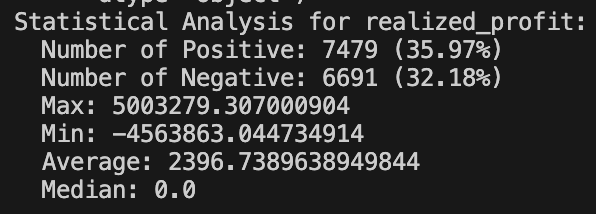
Giving just the wallets with existing realized profit, we see that positive slightly outperforms negative. We can also see that the wallet with the biggest realized profit got $ 5,003,279. Not bad, huh?
The worst one took a hit of $ 4,563,863. OUCH.
The average is $ 2,396, but this can be again very influenced by the big winners, since the median is 0.
Now, let’s move on and try some visualizations.
Visualizations
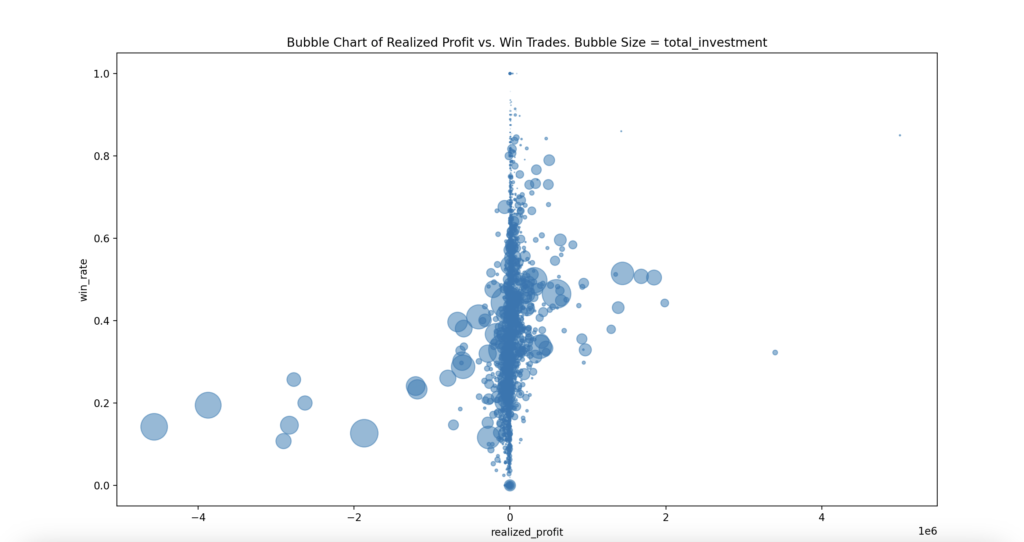
Here, we are analyzing realized_profit x win_rate, with the bubble size being related to total investment.
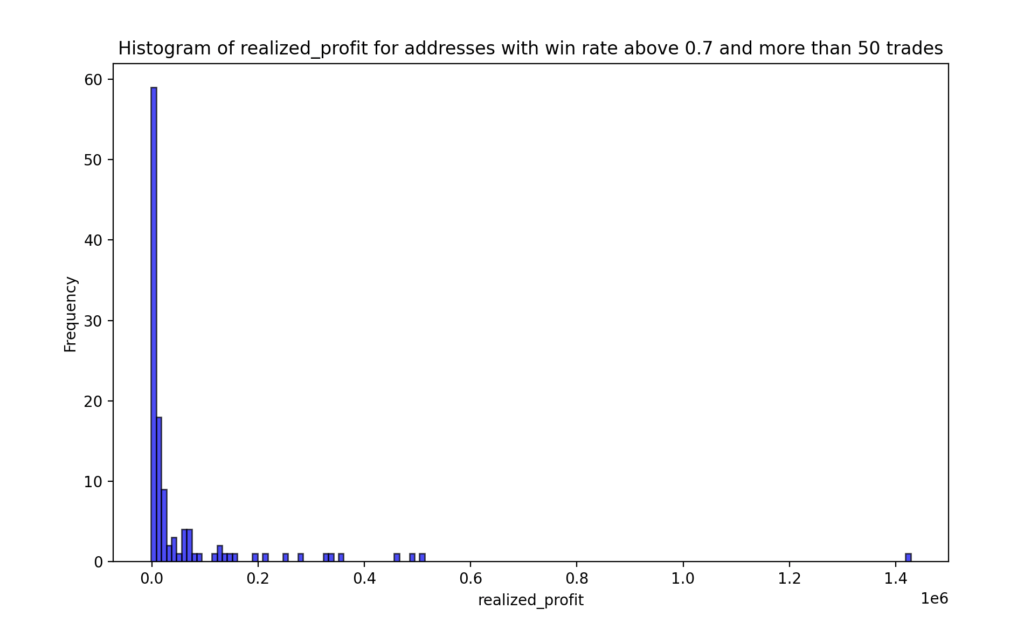
Here, even if we just analyze addresses with a great win_rate (above 0.7) and more than 50 trades, we will see that just some outliers have outstanding realized profits.
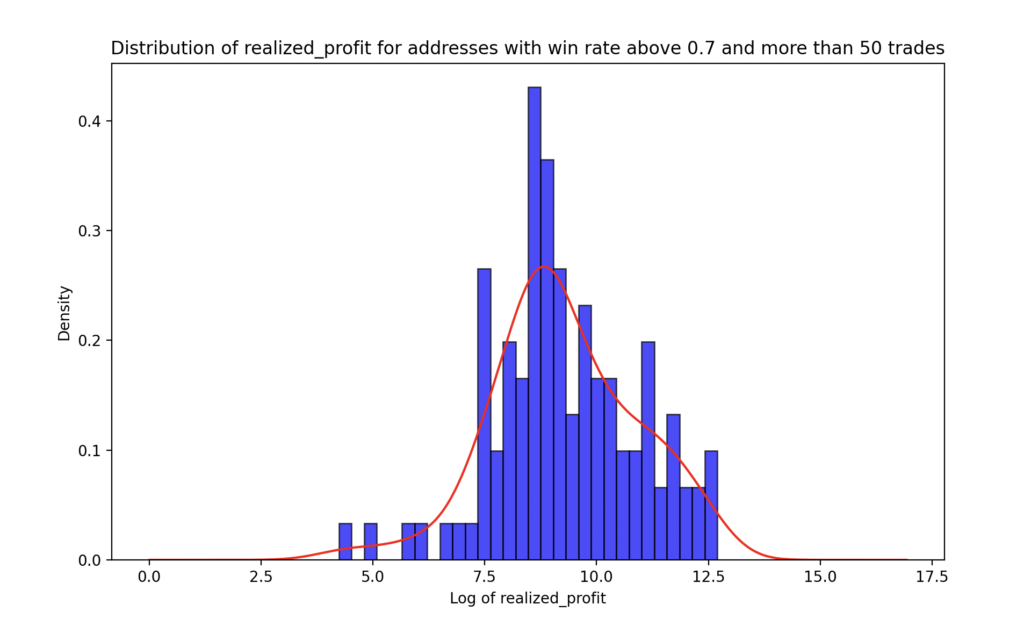
Above we have the same idea, but excluding outliers and applying a log transformation.
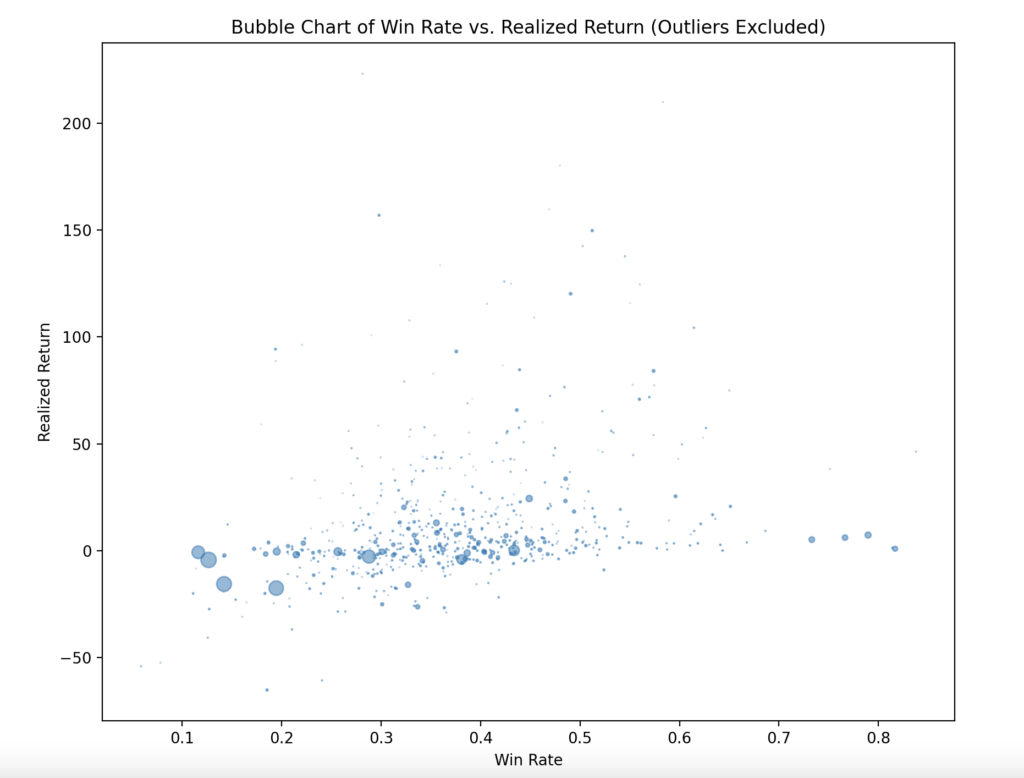
Lastly, let’s check win rate vs realized return for wallets that made between 500 and 999 trades. I excluded outliers. Also, bubble size is related to total investment.
Conclusion and Contact
- We can see that the majority of traders end up having negative results in their dex trading.
- Some traders are, of course, outliers, and will have huge returns, but they are very rare.
- High win rates above certain threshold not necessarilly lead to high realized return.
Since we got such rich data, I had much more conclusions than that, naturally, but due to privacy reasons, I can’t talk about all of them in this article.
If you are interested in talking about data, writing, blockchain or this research, you can contact me at tiago@inevitable.education or in my LinkedIn.